Welfare

Executive Summary
Poverty and inequality are one of the biggest challenges the current society faces, apart from climate change and political instability. It is no wonder that European countries spend around 30% of their GDP annually on social protection programs designed to provide safety nets for the poor or at risk of poverty population. Despite the best efforts, the effectiveness of such programs in alleviating poverty varies from country to country.
This report focuses on Greece which has suffered tremendously in the long run due to the financial crises and saw an increase in poverty rates. Moreover, as most other countries, Greece faces an aging population problem due to low fertility and birth rates. As old age is correlated with poverty, this puts an additional strain on the government budget, as it now must spend more on social protection services.
The report analyses the efficiency and effectiveness of such programs in alleviating poverty and reducing inequality while preserving incentives to work. For this purpose, Greece is compared with Finland which presents similar demographics and poverty rates before transfers. However, Finland is the happiest country in the world, fourth year in a row, and is more effective in tackling poverty.
After careful inspection, it was identified that Greece has a high percentage of means-tested programs and around 90% of the benefits are distributed in cash. Finland, on the other hand, has no means-testing and provides mostly in-kind benefits.
Therefore, to be more efficient in addressing poverty and changing economic and social conditions, Greece might benefit from increasing the proportion of benefits offered in-kind. This will ensure that incentives to work are preserved. Moreover, the eligibility criteria for some benefits should be relaxed as currently they are excluding some individuals in need and are offering very little support for the ones enlisted.
Chapter 1
1.1 Introduction:
The given policy report will provide an economic analysis of the social protection systems in Greece with respect to that of a comparison country. The goal is to examine the effectiveness and efficiency of such programs in alleviating poverty and inequality; hence, it focuses on non-contributory programs. Moreover, it identifies areas which should be reformed to better address current economic and demographic challenges.
The first chapter provides an overview of the current economic situation in Greece as well as the comparison country together with the structure and challenges faced by these programs. Chapter two deals with assessing the effectiveness of social protection and chapter three focuses on efficiency. Lastly, chapter four provides an assessment and proposes several reforms.
1.2 Trends in poverty and economic inequality
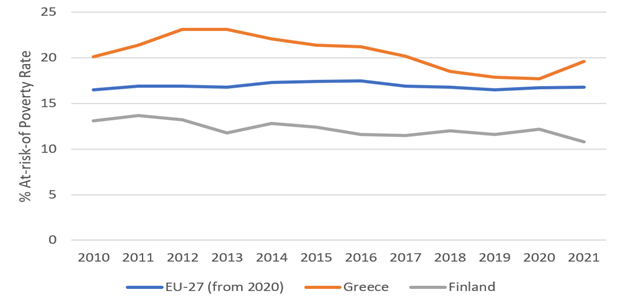
Figure 1. At-risk-of Poverty Rates (60% of median income) after tax and transfers. Adapted Source: Eurostat, 2022
Considering that the report is based on the poverty relief role of social protection, it is only fit to start by providing a picture of the current situation. Relative rather than absolute poverty is chosen as a measure as it better reflects the differences in income and standards of living for a given country and time.
According to Eurostat data, relative poverty rate after taxes and transfers was 19.6% in 2020. Figure 1 depicts that Greece presents consistently high poverty rates when compared to the EU average of about 16-17%. It is also noticeable how poverty is considerably affected by economic phenomena. The spike in poverty around 2012 – 2013 is a consequence of the 2009 financial crises which has affected Greece more than other European countries. In 2013, its economy contracted by 26% compared to the pre-crises level and it had to be bailed out three times. In 2018 the poverty rate declined and almost reached the EU average, but then it rose again due to the Covid-19 pandemic.
On top of combating these crises, high poverty rates put an additional strain on governments which must increase spending on social protection services. Moreover, high annual fluctuations in poverty levels imply that these programs should be designed such that adjustment is timely and efficient in addressing poverty while also limiting distortions of incentives to work.
1.3 Identifying the Comparison System
After much consideration, Finland was assigned as the comparison country. According to the World Happiness Report, Finland is the top happiest country in 2021, fourth year in a row. Nevertheless, relative poverty rate before transfers is 36.7%, which is higher than in Greece. However, social protection programs reduce it below the EU average, 11-14%, that is about 10% less than in Greece (Figure 1). Thus, there must be some lessons to be learned from Finland in terms of efficiency and equity.
In terms of wealth, economic and political stability, geographic area, and culture, the two countries differ drastically; however, they face similar demographic challenges.
Table 1. Demographic Descriptive Statistics. Adapted Source: Eurostat, 2022
| Population | Median Age | Life expectancy | Age Dependency Ratio | |
| Greece | 10.6 mil | 43.3 | 79.9 | 71.9% |
| Finland | 5.6 mil | 42.5 | 79.3 | 77.4% |
Apart from the fact that Greece’s population is twice the size that of Finland, the countries have similar life expectancies, median age, and dependency ratios. According to Eurostat, Greece and Finland have one of the highest dependency ratios, defined as the number of young (0-19) and elderly people (65 >) per head of working person. Since old age and children are characteristics correlated with poverty, a higher dependency ratio implies higher required spendings on social protection programs. Given that both countries face an ageing population problem, without necessary and timely reforms to old age benefits the government budget might be negatively affected.
1.4 Trends in Social Protection Expenditures
In this part, the attention is turned to the trends in social protection expenditures. According to Figure 2, in 2020 Greece spent 29.4% of its GDP on social protection services which amounts to 4738 euro/capita. The total expenditure is below the EU average even though it has increased since the financial crises. Finland on the other hand, spends 31.9% of its GDP and 11 725 euro/capita, which is above the EU average.
Even though the share of GDP spent is approximatively the same, expenditure per capita is almost three times higher in Finland. This might be an initial explanation of its greater success in alleviating poverty; however, it is necessary to compare the purchasing power parity of money before making any conclusions.
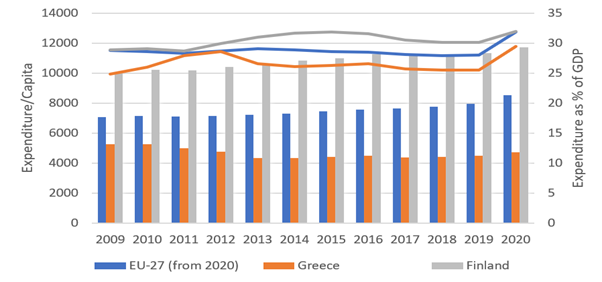
Figure 2. Social Protection Expenses/Capita and as % of GDP. Adapted Source: Eurostat, 2022.
Note: Lines show the expenditure as a % of GDP, bars show expenditure/capita.
The allocation between different social protection programs as a percentage of total spending is similar in Finland and Greece. Since both face an aging population problem it comes with no surprise that around 40% (Finland) and 57% (Greece) are spend on old age programs. This trend has been increasing and therefore it is essential that other benefits do not reduce incentives to work as this would decrease tax revenues and increase costs for the government.
Next in line are healthcare and family/children programs, the expenditure on which has increased in Greece while slightly decreased in Finland. Greece is spending more on survivors and other programs guaranteeing minimum resources, while Finland spends more on disability, unemployment, and housing.
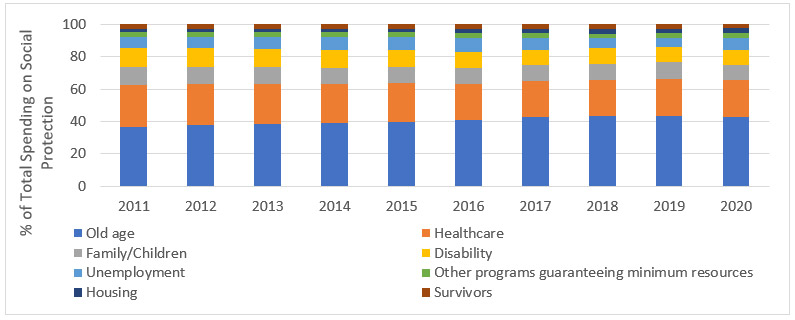
Figure 3. Share of total spending on different social protection programs in Finland. Adapted Source: Eurostat, 2022.
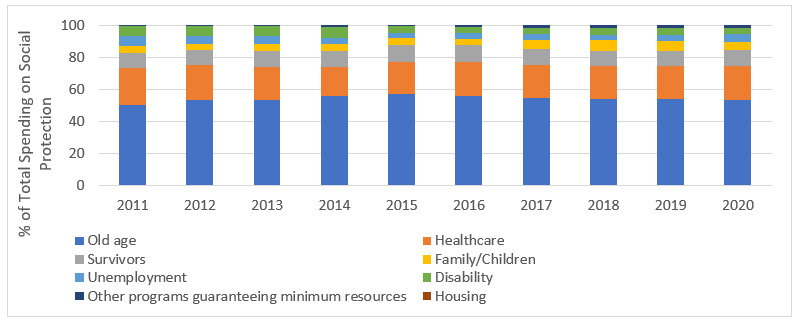
Figure 4. Share of total spending on different social protection programs in Greece. Adapted Source: Eurostat, 2022.
1.5 Challenges faced by Social Protection Systems
The general challenges faced by social protection programs is striking the right balance between reducing poverty and economic inequality while preserving work incentives. Inefficient programs lead to high costs for governments and limited results in alleviating poverty, which is undesirable especially in times of crises. Similarly, very generous benefits tend to decrease incentives to work, thus reducing tax revenues and increasing total spending on social protection. This might result in a national budget deficit especially in times of economic turmoil. Moreover, demographic challenges such as an ageing population or high divorce rates which increase the number of single parents, puts additional pressure on increasing spendings. Hence, an optimal choice in the design of such programs is essential to achieving desired results.
Chapter 2
2.1 Effectiveness in alleviating poverty
The effectiveness of social protection programs meant to help those at risk of poverty can be assessed by the change in poverty rates before and after transfers of benefits and taxes. Poverty can be measured using absolute and relative measures. Absolute poverty looks at individuals below a certain threshold of income who are assumed to not be able to meet their basic needs. Relative poverty rates look at individuals below a certain percentage of the median income in a specific country. The European Commission uses 60% of the median income as a measure for the latter definition (Eurostat, 2022). Given that Greece and Finland differ in standards of living and average income, relative poverty rates are a better comparative measure in this report.
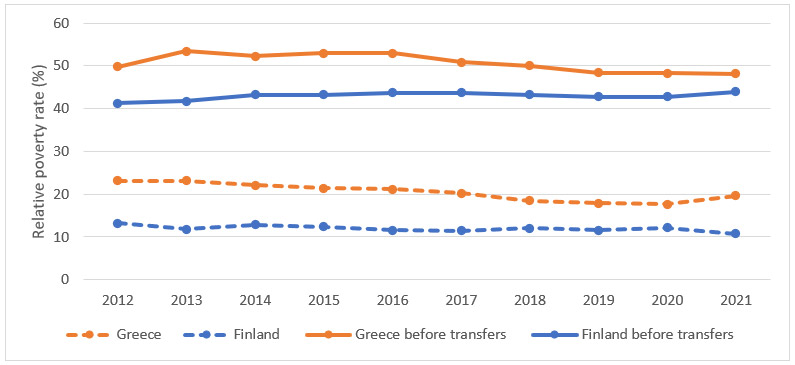
Figure 5. Relative poverty rates in Greece and Finland before and after transfers of benefits and tax, 2012-2021. Adapted source: Eurostat, 2022
According to Figure 5, in 2021 the relative poverty rate before transfers from social protection programs was 48.2% in Greece. After all transfers, this fell to 19.6%. In Finland, social benefits reduced poverty from 45% to around 11%. Since relative poverty decreases, this indicates that the social protection programs indeed have a positive effect on poverty alleviation.
Social protection programs come in a variety of forms, each focused on specific at-risk groups. Naturally, they differ in the effectiveness of targeting the poor due to their structure and the number of monetary resources allocated.
In Greece, old age, survivors, health, disability, and unemployment programs make up more than 90% of total spending on social protection systems (see Figure 4). It is therefore not surprising that these programs account for the largest share in the reduction of poverty rates. In Finland, this share of total spending is considerably lower, slightly more than 80%. The fraction of spending on family/children, housing and other social exclusion programs guaranteeing minimum resources are all higher in Finland than in Greece. Consequently, they play an insignificant role in poverty alleviation in Greece.
To assess the effectiveness of social protection programs in the alleviation of poverty, two criteria must be considered: horizontal and vertical efficiency. Horizontal efficiency implies that those who would be poor in absence of the programs benefit from them. Vertical efficiency measures whether those not in need, do not benefit from them. Hence, a perfectly efficient program would only target and benefit poor people and offer no help to those above the poverty threshold.
Both in Greece and Finland, the largest share of spending on social protection systems is on old age and healthcare programs (see Figures 3 and 4). To achieve target efficiency, poor people should be eligible for the benefits. As there is a national pension plan in Greece, that is not means-tested except for legal residency, it is ensured that people in need of this benefit can claim it, increasing horizontal efficiency. However, the largest part of the pension plan is based on compulsory social insurance financed through the current income (MISSOC, 2022), which is lower or non-existent for those at risk of poverty, limiting the target efficiency. Looking at Finland, there is an additional “guarantee pension” for those in need, which could be useful in Greece too. The health care system in Greece is based on compulsory social insurance contributions as well. Since this insurance is linked to income, individuals can slip through this safety net due to long-term unemployment or because automatic insurance of dependent family members is not applicable anymore. In Finland, all residents are covered by the public healthcare system (MISSOC, 2022). To improve horizontal target efficiency, Greece could apply this system as well.
Means-tested programs, which account for more than 50% of family/children, housing and other social exclusion programs in Greece (Eurostat, 2022), imply that applicants need to be investigated on their needs and resources before receiving any benefits. This is a way of targeting the poor population while also limiting the total expenditure on such programs. Even though a higher fraction of means-tested programs would increase vertical efficiency, it might have the undesired effect of excluding some of those at risk of poverty by making it more costly to seek help. Compared to Finland, Greece has a larger share of means-tested family/children, housing and other social exclusion programs. A direct consequence is that Finland has low vertical efficiency and, thus, higher overall spending on social protection.
One possibility for improving vertical efficiency in Greece is by increasing the share of in-kind versus cash benefits which can come in form of free day-care services or healthcare for those eligible. In-kind benefits can be designed such that they ensure basic resources for the poor and exclude those relatively well-off. The current health care program is a perfect example of in-kind benefits. Family/children programs, however, are mainly distributed as cash benefits, around 90% (Eurostat, 2022), which have the undesired effect of distorting work incentives. Thus, they would benefit from a structural change.
2.2 Effectiveness in reducing income inequality
To assess the effectiveness of the social protection systems in reducing income inequality, a more in depth investigation of the impact created by transfers is needed. Income inequality implies an uneven income distribution among the population. Therefore, poverty is positively correlated with income inequality. Hence, the analysis performed in part 2.2 is still applicable here.
Further, the Gini coefficient is used to get a better picture of inequality. It is a statistical measure which can take a value between 0 and 1, where 0 indicates a perfectly equal distribution of income and wealth among the population, while 1 implies complete inequality. The data reveals that Greece has a Gini coefficient of 0.33 in 2019, whereas in Finland it is 0.28 (World Bank, 2022).
For the period 2015 -2019, the Gini coefficient has been decreasing in Greece while slightly increasing in Finland. Moreover, Figure 2 indicates that between the same period, the total spending on social protection programs slightly increased in Greece while decreasing in Finland. Additionally, Greece experienced a decrease in relative poverty rates (see Figure 5). Hence, this is further proof that inequality is positively correlated with poverty and inversely correlated with total spendings on social protection.
Nevertheless, it is important to note that not all programs have a similar effect of inequality. As in the case of poverty, a higher share of means-tested programs is more efficient in reducing economic inequality. Hence, family/children benefits will have a negative effect on equality as they are offered to both poor and non-poor households, further increasing the inequality gap especially for the poor individuals with no children. Moreover, old age benefits will have a similar effect since they are mostly contributory. Hence, poor individuals will receive lower benefits which further increases their relative poverty. To correct for this effect, it would be useful to implement a “guarantee pension” for those in need as is the case in Finland.
To conclude, an effective approach in increasing overall efficiency of social programs while reducing income inequality would be to focus mostly on means-tested benefits where possible. Moreover, switching from cash to mostly in-kind benefits, as is the case of Finland, would further ensure that those in need possess basic resources without increasing the income inequality gap.
Furthermore, in case of non-means tested programs, supplements targeted at poor households might be needed to increase target efficiency.
Chapter 3
3.1 Programs of interest
While the previous chapters provided an overall analysis of the efficiency of social protection programs in poverty alleviation, this part will take a more targeted approach. As mentioned previously, some benefits have the undesired effect of increasing inequality or have a very low effect on poverty. Hence, this chapter specifically focuses on family/children programs in Greece and Finland as to get a better idea of how they might be improved.
To identify design errors, a general picture of the types of programs together with their eligibility criteria for each country will be presented.
Data from the OECD database on social expenditure as well as information from the European Commission page (European Commission, 2022), identify the following programs in Greece:
- Child allowance: until child turns 18 (24 if student) or permanent if the child is disabled and was diagnosed before 18. Beneficiaries need to reside in Greece permanently and constantly for at least 5 years (12 years if they are non-EU citizens).
- Maternity Allowance: payable 56 days before and 56 days after confinement
- Other Cash periodic benefits:
- Single parent
- Accommodation and reallocation allowance
- For single unemployed mothers who are married to a prisoner or soldier
- For Greek emigrants coming back to Greece
- The Special Allowance for Having 3 Children: if the family has 3 or more children (depends on income)
Before moving on, it is important to note that it is relatively difficult to find information about social protection benefits in Greece. The data was collected from multiple sources, and it still seems incomplete. However, in the case of Finland, the information is presented in an accessible manner on the infoFinland.fi website. Moreover, it offers information of the application procedure and which organizations to contact. Hence, this lack of accessible information is a n additional barrier that might account for a lower efficiency in targeting poverty in Greece.
Finally, Finland’s family programs are divided into:
- Maternity grant: choice between a baby box or a fixed sum of money (eligible if the pregnancy lasted for more than 5 months and you had a medical examination at the end of the 4th month)
- Pregnancy allowance paid for 40 days: granted only to the mother
- Special pregnancy allowance: in case your work exposes you to radiation, chemical substances, or infectious diseases
- Family leave/Parental allowance: usually 70% of your normal income in case your employer doesn’t pay you a salary during that period
- Child home care allowance: it consists of basic allowance and a supplement which depends on family income
- Flexible/partial childcare: for part time child leave meaning that you work shorter hours (<30h/week)
- Child benefit: paid until the child is 17; around €100/month for the first child and a slightly higher amount for each following child (possible to be paid abroad)
- Child benefit supplement: for single parents
- Early childhood education and care: free of cost full-time or part-time care of multiple forms: day-care centre, in family day-care, in group family day-care or alternative arrangements.
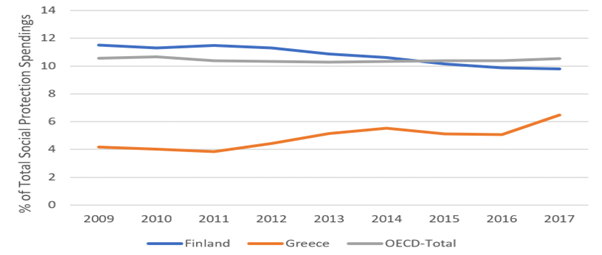
Figure 6. Fraction of total Social Protection Expenses spent on Family/Children programs. Adapted Source: OECD, 2022
Stepping back and looking at the bigger picture, Figure 6 indicated that around 6.5% of total expenditure on social protection programs is spent on family/children benefits in Greece. This is approximately with 4% less than the OECD average, however, the gap is slowly starting to narrow. Finland spends 9.7% which is slightly below the OECD average and represents a reduction compared to previous years.
The economy of Greece has suffered enormously in the past decades and simultaneously the total spending on social benefits had to be increased due to rising levels of poverty. Hence, budget limitations present the most difficult challenge for Greece. Therefore, efficient targeting is ever more important. On the other hand, Finland is challenged by increasing divorce rates, one of the highest in the world (Hautamäki, 2001). This results in more single parents and hence a higher public spending on child benefit supplements.
3.2 Efficiency in targeting those most at risk of poverty
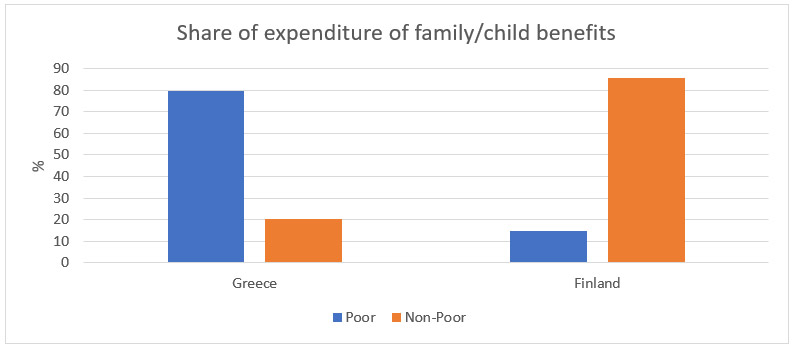
Figure 7. Share of expenditure on family/children benefits spend on poor and non-poor households. Adapted source: World Bank, 2019.
According to World Bank data, Greece spends 80% of total family benefits on poor household (see Figure 7). This is an indicator of high horizontal efficiency and is most likely due to stricter eligibility criteria compared to Finland as can be deduced from part 3.1. Moreover, 50% of these programs are means-tested. However, vertical efficiency can be improving as 20% of spending goes to non-poor households.
Finland on the other hand spends only 15% of family benefits on poor households. Seeing that before transfers, Finland has a higher relative poverty rate compared to Greece, it could benefit from more targeting. Vertical target efficiency is low as 85% is spent on non-poor households and there no means-tested programs. By redesigning their programs to include stricter eligibility criteria, Finland can considerably increase efficiency and cut costs.
3.3 Effect on incentives to work
Social protection for family/children, although may be essential, could lead to disincentivizing people from working. To combat this problem, governments can implement certain eligibility criteria. As discussed before, this will increase targeting efficiency, but at the same time it might induce some households to work less to qualify for benefits. This is the negative effect of distorting incentives to work and is mainly caused by cash benefits. Since Greece offers 90% of these benefits in the form of cash, compared to 40% in Finland, a careful design of the eligibility criteria is essential (Eurostat, 2022).
Greece for example offers support to children until the age of 18-19 on the condition that they are enrolled in a secondary education. Finland offers a pregnancy allowance paid for 40 days before or after birth. The conditional support provided by these governments offers some financial relief when it is most necessary. However, it is also strict enough that families do not rely on them in the long run. Hence it minimises disincentives to work.
Referring again to Figure 7, it can be stated that the combination of strict eligibility criteria and efficient horizontal targeting in Greece results in minimal distortions on incentives to work. On the other hand, Finland must introduce some type of means-tested programs to limit the number of benefits received by non-poor households and hence the loss of efficiency due to a decrease in work incentives.
To conclude, for better results in reducing poverty and inequality, Greece should increase their total spending on social protection programs as they have a rather high targeting efficiency. However, distributing them as in-kind benefits might have a more favourable effect as it will limit disincentives to work. Finland, however, could save a lot of tax money by reducing cash received by non-poor households, which implies introducing means-testing.
Chapter 4
Summary and Discussion
The social protective system of Finland is seen as one of the best in the world. Mainly because it has a high expenditure on programs, which results in a decrease of the poverty rate. Greece is forced to focus on their targeting efficiency as it does not have much money to spend. It is characterized by its high share of means-tested benefits.
Budget limitations present the most difficult challenge for Greece. Therefore, efficient targeting is ever more important. In the case of Finland, the main challenge is increasing divorce rates. This results in more single parents and hence a higher public spending on child benefit supplements.
The main findings arising from chapters 2 and 3 are that transfers have an important role in alleviating poverty and reducing income inequality. Furthermore family/children, housing, and other social exclusion programs increase equality. Additionally, Finland has no means-tested family/child benefits, which results in a vertical inefficient program. However, the Greece family/child program is very efficient in targeting the poor households, almost 80% of the expenditure goes to poor households.
Although Greece may be set back by their budget limitations, it provides incentive to means-test more. This allows for them to target the audience who are in actual need of the support rather than families who would be provided with further comfort such as the cases in Finland as 85% of the population that receive social protection funding goes to non-poor households. Greece’s high vertical and horizontal efficiency allows them to strike a better balance between effective prevention of poverty and preservation of incentives to work. As non-poor households do not necessarily need the provided additional support. In cases such as Finland the effect on aggregate incentive to work is larger as it disincentivizes these households. Although social protection as a whole has been proven in alleviating poverty and having a positive impact on income inequality it has been discovered that family/child, housing, and other social exclusion programs are not as contributing to poverty alleviation as other categories. Hence it can be concluded that both Finland and Greece should deviate more budget and attention towards these 3 programs in order to increase the general effectiveness of the social protection ideology.
Moreover, although it is contributory to Greece’s vertical and horizontal target efficiency, means-testing requires a budget on its own causing it to be an inefficient solution to an already budget restricted economy. Therefore, to increase their efficiency Greece should come up with a way to decrease their means-tested percentage or innovate new advancements to decrease the cost of means testing per capita. This would allow them to accumulate more budget that could be focused on the 3 social protection programs that are not currently contributing to poverty alleviation as much.
On the contrary Finland should apply a method to increase their means-tested percentage which would allow them to increase their target efficiencies and more importantly decrease the negative effect they have on work incentives.
Greece should increase their total spending on social protection programs as they have a rather high targeting efficiency. Distributing them as in-kind benefits will have a more favourable effect as it will limit disincentives to work.
As family/children, housing, and other social exclusion programs reduce inequality, it is most effective to focus on these programs. The share of expenditure of Greece on family/child programs is below the average of the OECD (figure 5). Therefore a policy change, where the spending on this program increases will result in a reduction of poverty and inequality further. In General, raising the expenditure on social protection programs will reduce poverty and inequality in Greece, because it has a high target efficiency. Compared to Finland, which has a high expenditure on social protection programs, the poverty is lower than in Greece, which confirms the success of this policy change.
Finland can improve the target efficiency of its family/child programs. By introducing stricter eligibility criteria, the vertical efficiency will increase resulting in a reduction of expenditure. The saved money can be spent in other social protection programs to reduce poverty and inequality.
Bibliography:
Hautamäki, A. (2001). FINLAND IN THE FACE OF CHANGE. Retrieved from https://sitrafi.s3.eu-west-1.amazonaws.com/2017/02/28141952/raportti19-2.pdf
European Commission (2022). Greece - Family benefits. Opgehaald van European Commission:
https://ec.europa.eu/social/main.jsp?catId=1112&langId=en&intPageId=4560
Eurostat (2022). Population & Demography. Retrieved from https://www.stat.fi/tup/suoluk/suoluk_vaesto_en.html
Eurostat (2022). Social Protection. Retrieved from https://ec.europa.eu/eurostat/web/social-protection/data/database
infoFinland.fi (2022). Financial Support for Families. Retried from https://www.infofinland.fi/en/family/financial-support-for-families
MISSOC. Comparative tables. Retrieved from https://www.missoc.org/missoc-database/comparative-tables/results/
OECD (2022). Social and Welfare Statistics. Retrieved from https://www.oecd-ilibrary.org/social-issues-migration-health/data/oecd-social-and-welfare-statistics_socwel-data-en
World Bank. (2019, January). A Quantitative Evaluation of the Greek Social Solidarity Income. Retrieved from https://documents1.worldbank.org/curated/en/882751548273358885/pdf/133962-WP-P160622-Evaluation-of-the-SSI-Program-Jan-2019.pdf
World Bank (2022). Gini Index. Retrieved from https://data.worldbank.org/indicator/SI.POV.GINI?end=2021&most_recent_value_desc=false&start=2004
World Happiness Report (2022). Retrieved from https://worldhappiness.report/ed/2022/happiness-benevolence-and-trust-during-covid-19-and-beyond/#ranking-of-happiness-2019-2021
Share:
Related Articles

Suggestion Pool or Dust-Gathering Bo ...
In many companies, a "suggestion system" is set up, runs with enthusiasm fo ...

There Was Inventory, But No Cash: Th ...
While consulting for one of my clients, I once again encountered a misconce ...
Transformation Doesn't Begin in Code ...
The same fundamental mistake appears in the vast majority of failed digital ...

The Product Existed, the Future Didn ...
One of the least discussed yet most destructive risks to sustainability is ...

Surviving Is Not Enough: The Ability ...
The global business environment has become increasingly unpredictable. Geop ...

Financial Crises Do Not Begin Overni ...
Access to finance plays a vital role in enabling companies to achieve their ...

Lessons from the Past, Strength for ...
There is an unavoidable truth in life and in business: things do not always ...

Intuition and "Cognitive Finance" in ...
Today, the financial world is experiencing one of the greatest paradigm shi ...

Corporate Sound Strategy
Modern business life is living through a major paradox. On one hand, compan ...

Finance Exists Through People
For many years, finance has been explained through the language of numbers. ...

The Financial Architecture of the Fu ...
In traditional economic doctrines, a company's success was measured by metr ...

The Silent Problem of Corporate Life ...
Companies make mistakes. This is natural. In fact, an organization that doe ...

How Is a Leader Shaped?
Leadership is often described as a one-directional force: a figure who make ...

The New Direction of Capital
In recent weeks, a notable trend has emerged in global markets: a visible p ...

Turkey’s Automotive Industry: On the ...
Turkey’s automotive industry has managed to preserve its production volume ...

Healthy Growth: Why Organizations Sl ...
Companies want to grow. More market share, higher revenues, larger organiza ...

Sustainable Leadership: Power Built ...
Today, the concept of sustainability sits at the center of almost every str ...

Why Do Managers Struggle with Genera ...
A reality long felt in the business world is this: there is a natural diffe ...

Leadership
Support, love, and trust received in childhood nurture self-confidence, cou ...

Generation Z: Not Just a Mirror, but ...
One of the most frequent complaints in today’s business world is: “Young em ...

A New Era in Business with Artificia ...
The Industrial Revolution began with steam. Then came electricity, computer ...

The New Face of Entrepreneurship: Wo ...
The new generation of entrepreneurship is no longer solely profit-driven; i ...

Understood Employees Contribute and ...
In the corporate world, we often hear statements like: “They’re talented, b ...

The Silent Power of Corporate Succes ...
In today's business world, organizations operate in an environment shaped b ...

Customer Relations and Training in B ...
Bancassurance, a business model in which banks market insurance products to ...

What Awaits the Business World? A St ...
Digitalization is no longer just a technological trend but a necessity for ...
Digital Transformation in Conflict M ...
Conflict is a reality we encounter in all aspects of life. Whether at home, ...

The Road to Success: Market Dynamics ...
In today’s rapidly changing market conditions, the importance of management ...

Leadership in the Digital Age: A New ...
Leadership in the digital age requires embracing continuous learning, innov ...

Mastering Risk Management
Mastering risk management is not merely an option for businesses but a nece ...

International Banking in Germany: A ...
Germany, with its strong industrial structure, high-technology products, an ...
Leadership and Maslow's Hierarchy of ...
Abraham Maslow's hierarchy of needs is a fundamental psychological theory u ...

Leadership and Sustainability of Org ...
Today's business world is characterized by continuous change, technological ...

The Importance of Coaching Skills f ...
The Importance of Coaching Skills for LeadersCoaching skills are essenti ...

Fintech in Turkey: The Rise of Finan ...
Fintech in Turkey: The Rise of Financial Technology

Bancassurance
Bancassurance is a business model that is among the financial services offe ...

Banking and Frankfurt
When the banking and finance sector in Europe is analyzed, it is seen that ...

Digital Banking and Germany
Digital banking is a banking service where customers can do their banking o ...

Banking in Germany
Euro used since 2002 in The Eurozone, the currency of 19 EU members. There ...

Strategic Communication
Strategic communication plays a critical role in the success of an organiza ...

Importance of Supply Chain
The supply chain is a critical factor in which a company manages the flow o ...

Key to Success: Going Digital
Digital transformation is a transformation process that aims to increase th ...
Welfare
Poverty and inequality are one of the biggest challenges the current societ ...

ChatGPT
ChatGPT, developed by the OpenAI company known for its work and research in ...

What is Emotional Intelligence and w ...
Emotional intelligence (also known as emotional quotient or EQ) is the abil ...

The Importance of Women's Employment ...
Women's participation in the workforce is closely related to the level of d ...

Digital Banking II – Digital Banking ...
A serious step taken for the spread of “digital banking” in Turkey, providi ...

The Perception of Morality within Ma ...
If everybody in the world jumped out of a window, would you? This question ...

Digital Banking
Digital banking is a banking technology that offers customers the opportuni ...

Banking, Artificial Intelligence and ...
We have heard the concepts of metaverse, artificial intelligence and machin ...

Green Asset Ratio
Sustainable finance has an important place among the investments made for t ...

Servant Leadership
There is an effective form of management that we often hear about today: se ...

Sustainability In The Global Banking ...
Before Covid-19 wreaked havoc on the world’s economies, the global banking ...

Revolution of Digital Banking
With the European Central Bank considering to investigate for a digital cur ...

Taking Action and Making Decisions i ...
Uncertainty is the fact that an event is not within the framework of certai ...

Wind of Change
Change is an important concept that must be managed for employees at all le ...

Organizational Justice
“What is justice? Giving water to trees. What is injustice? To give water t ...

Open Banking
Digital transformation has started to show its effects in every aspect of o ...

Digital Literacy And Corporate Life
There are many innovations that managers and employees need to follow in or ...

Financial Literacy
The words money and economy are two important concepts that have a great pl ...

Sustainability and Bank
The solutions we have found to our various needs throughout history and ada ...

Adaptability, Flexibility and Leader ...
Being able to adapt to changing conditions is very, very important not only ...

Creativity and Leadership Relationsh ...
The world is getting more competitive every day. For this reason, the servi ...

Competitive Analysis and Banking Sec ...
Competition analysis requires you to examine your direct and indirect compe ...
Delegation in Management
The statements "two heads are better than one" or "teamwork makes the dream ...

Climate Change
All creatures evolve to best adapt to environmental impacts. Those who are ...

Change of Banking Service Channels i ...
Global crises such as the pandemic, force the existing structures to change ...

Innovation
It is undeniable that innovation has a very important place in today's worl ...

Artificial Intelligence
Artificial intelligence is no longer just something specific to science fic ...

Entrepreneurship
Entrepreneurship is the process of starting a new business that incorporate ...

Global Leadership
The world is changing day by day and the information we have today is out o ...

Resilience and Leadership
We encounter many events in life that cause us difficulties and stress. How ...

Entrepreneurial Spirit for Leaders
Why is important for success? The conventional perception of entrepreneursh ...


Finance Leadership in a Pandemic
Crises bring along a period in which institutions need to review their fina ...

Crisis Management
Crisis is a state of tension that puts the existence and goals of an organi ...

Strategic Leadership and Pandemic
Strategic Leader is the person who sets the roadmap to achieve the ultimate ...

Awareness, Appreciation, Success
It is very important for a person to recognize himself, discover his power ...

Woman and Career
People who are raised by unemployed mothers have a mother model in their mi ...

Conflict Management
In the broadest sense, conflict is disagreement between two or more people ...

Leading with Kindness
Kindness is an important virtue. Kindness in all areas of life makes relati ...

Smart Meetings
Meeting management is the process of managing all stages and components of ...

Negotiation Management
Negotiation is defined as a dialogue aimed at reaching a common and benefic ...

Virtual Leadership
The repercussions of the digitalization process in business life were sprea ...

Manager and Patience
Patience is an important concept in management. Patience is active, not pas ...

Being All Ears
Human beings differ from other creatures in their way of communicating. Com ...

Networking
The fact that managers in the corporate world act with awareness of network ...

Asking Strong Questions
For managers, asking a strong question is an important skill. Managers, who ...

Managing Yourself
The manager at work is in communication with the other parts of the busines ...

Mental Immunity
In the fight against Coronavirus (Covid-19) pandemic, knowledge and awarene ...